We received quite a few questions around the Time-On-Site metric with bots. Sometimes they have hour-long sessions, which seems implausible, considering that they are bots.
This article explains the metric time on site in Log Hero and how to interpret it and helps you add a new Calculated Metric avgPageloadTime that is complementary to Time-On-Site and sometimes more useful.
Time on Site with bots
To understand why very long Time-On-Sites occur with bots, it’s important to understand how they come to your site and fetch your data. As long Time-On-Sites are mostly coming from Googlebots, this is about them:
A Googlebot will enter a URL from one of Google’s data centers across the world. It now downloads the entire content of the page. Once it is on Google’s servers, it might even – depending on the bot – wait for JS resources and render the site. The content is now processed and saved at Google in an indexable format. This process usually only takes a few seconds.
Long pauses in between crawls
Based on the crawl data of a couple of thousand websites, we have seen that especially on small and medium-sized sites, Googlebots don’t crawl consecutively and fast-paced. Googlebots might just download a single site and not return at all. Sometimes though, they continue indexing a new URL on the site, which might be hours later.
How Google Analytics interprets this
If the Googlebot – assuming it’s the same IP and data center – continues crawling another URL, Google Analytics will attribute each hit / page-download to a single session. Since there are sometimes long pauses in between each download from the bot, these sessions might take much longer than one would expect.
It’s important to understand that the bot is not sitting still on the site but all it did was download the content and it only comes back much later.
Average Page Load Time
To understand how long Googlebots (and others) are on your site, one should look at how long it takes your site to send it all the content that they requested. Google’s bandwidth is essentially unlimited, so the constraining factor is your own site.
One of Log Hero’s custom dimensions is called Page Load Time and it states how long it took for all content to be delivered to the bot or human that requested it. To make this metric more meaningful, one should add the average as a Calculated Metric:
Adding Average Page Load Time
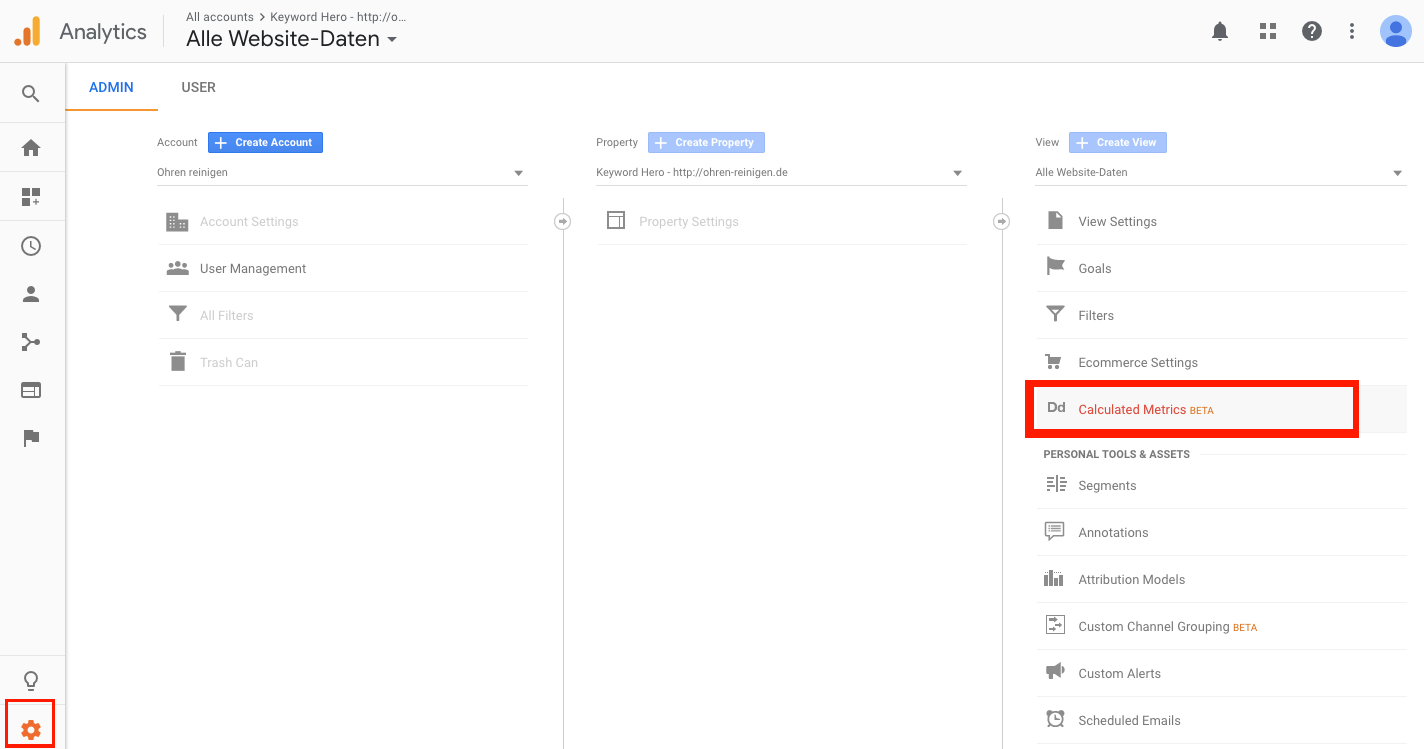
- Go to your Google Analytics account and click on the Admin button on the bottom left and click on the Calculated Metric section:
- Add the Calculated Metric AvgPageLoadTime and make sure to spell everything exactly as it shown below:
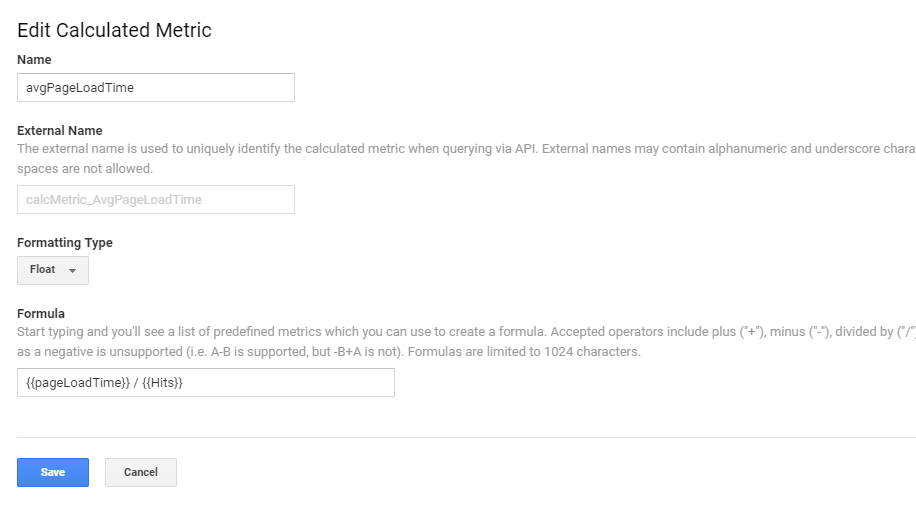
You have now added AveragePageLoadTime to your GA account. It shows you exactly how long it took bots to download your site’s content in milliseconds.
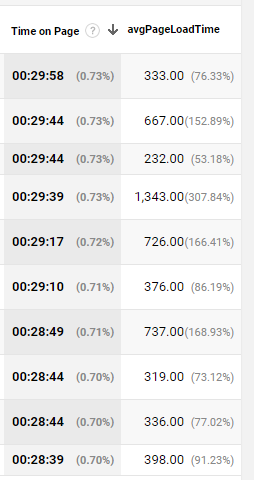
Comparing Average Page Load Time and Time on Site
Below you find a table comparing the Time on Site / Page with the average Page Load time. While the first one is in minutes (the first results are all close to 30m, which is Google’s session timeout) and behind it the average page load time in milliseconds.