This post is all about answering one question:
How many human visitors do you really have on your website?
While Google Analytics provides a basic answer to this question, it’s not all that accurate.
Why?
Firstly, Google Analytics is based on a Javascript code, and there are ways that users can avoid being tracked such as by using a firewall, blocking DNS requests or using the Google Analytics opt-out extension. In fact, around 20% of users block Google Analytics.
Secondly, Google Analytics includes some bot traffic in your user data. Google Analytics can filter out this bot data, but
Our goal is to include users that block Google Analytics while comprehensively excluding bot traffic.
So is there a way to do both of these things and track all your human web traffic? Yes!
Enter log files.
Log files store valuable information about all visitors to your site. Unlike Google Analytics they are not dependant on javascript, or they deal with HTTP requests.
The reason Google Analytics is so much more common than log files is that it is much more user-friendly. Up until recently log files remained the domain of the hardcore SEO combing through hundreds of thousands of rows of Excel data.
Log Hero combines the accuracy of log files with the usability of Google Analytics.
Using custom dimensions, Log Hero can display server log file data alongside Google Analytics traffic metrics. This is a huge time saver.
New to Log file analysis? Check out this handy guide.
Note to use the Is Bot custom dimensions you will need a paid Log Hero plan.
Let’s give this a try.
Firstly, go to the main view of your Log Hero property and set Is Bot as a secondary dimension to see your most requested resources.
Behaviour > Site Content > All Pages
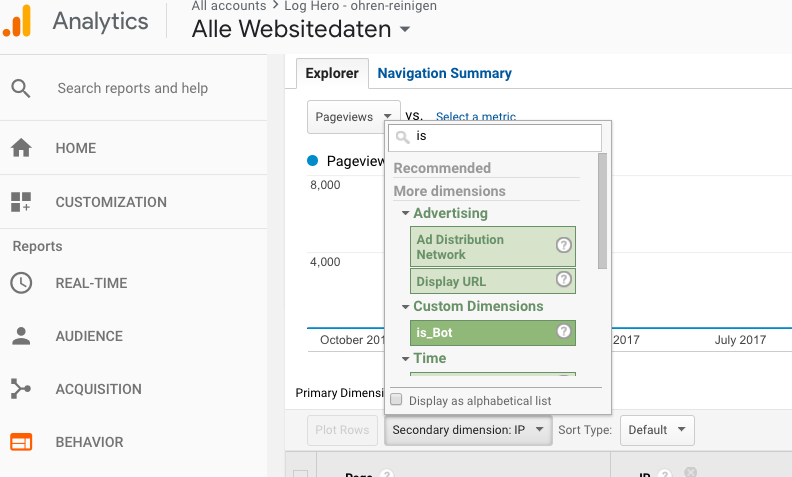
Looking at the results, you will see that False in the column Is Bot indicates all users that are not a bot.
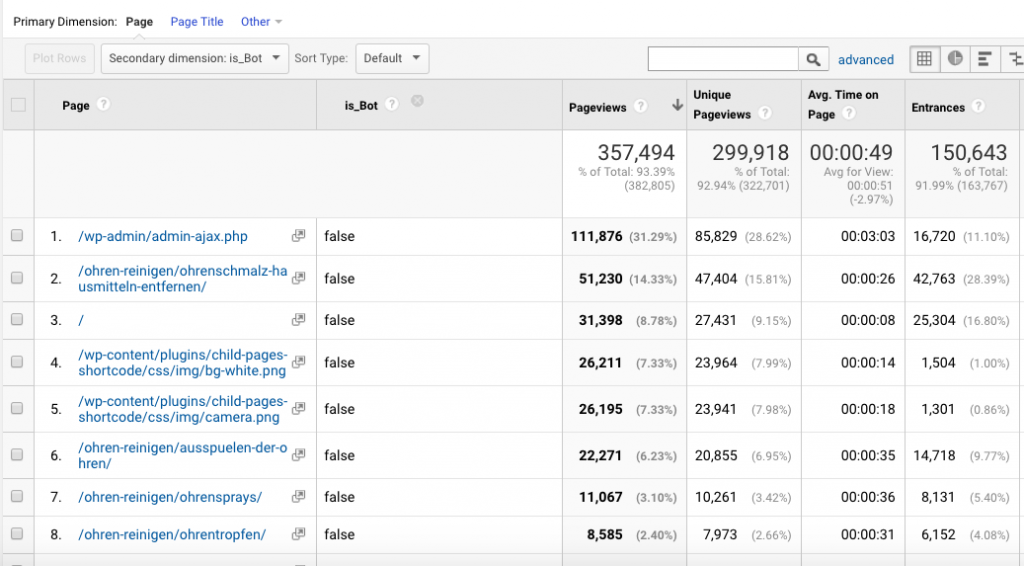
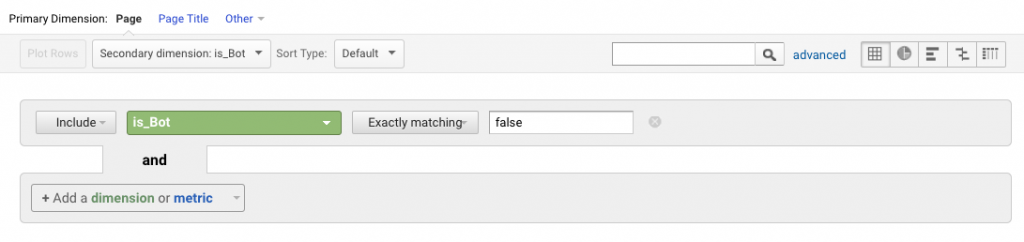
Now, let’s use an advanced filter to display these hits only. Click on advanced next to the magnifying glass and the search bar. Select Is Bot as a secondary dimension and then choose Exactly matching and type false into the box. This will exclude any hits that were triggered by a bot.
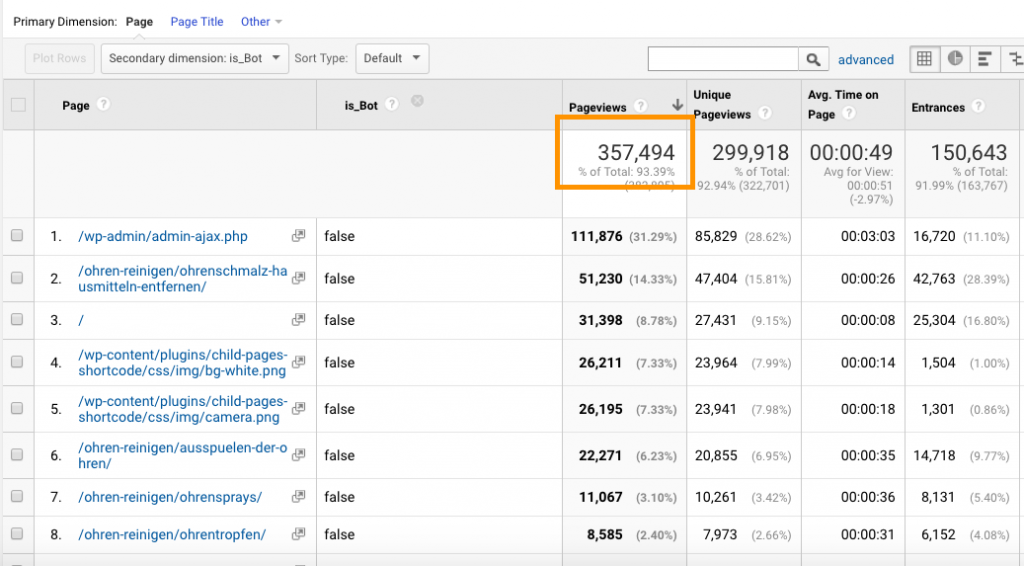
And that’s all there is to it! This total figure, in this case, 357,494 is the total number of human visitors to our site in the given period. That was a whole lot easier than combing through the server log files, and manually filtering the user agent to remove bot traffic and mapping the pages to the traffic hits.
Beware of the spammers
If you take another look at our results, you’ll notice that the most requested resource was the admin-ajax.php page. This is page related to admin control of the WordPress installation. If they are not bots crawling this trying to index this page, then what happened?
These are, in fact, human users trying to hack into the WordPress installation. Log Hero has a feature that can map known attacker IPs to your visitors. This spam detection feature is available with the Ultimate plan.
Upgrade to Ultimate to get Spam Detection
Log Hero Custom Dashboards
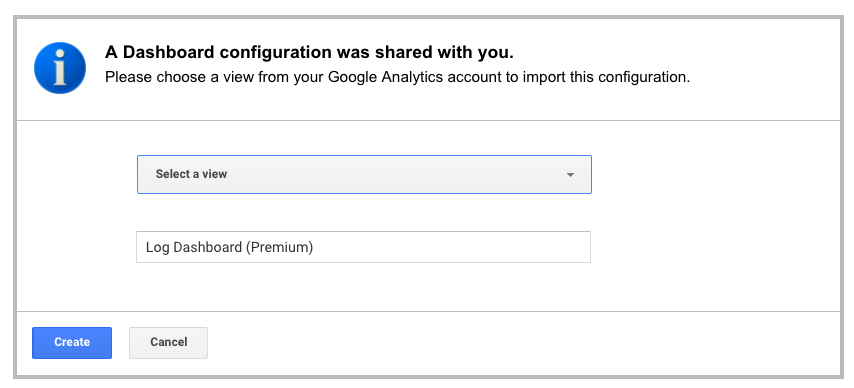
To see the amount of bot vs human traffic at a glance from within Log Hero you can grab the Premium Dashboard available with the Big plan (for limited use) and for unlimited use with the Log Hero Giant plan. Head over to our dashboard page and select the premium dashboard.
Add the Dashboard to your Log Hero property and click Create.
To view your dashboard head into your Log Hero property and select Customization > Dashboards and your chosen dashboard.
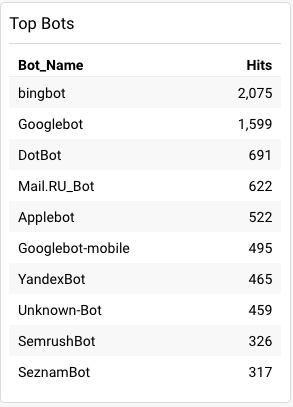
At a glance, you can now see human vs bot visitors, as well as which bots crawled your website most often.
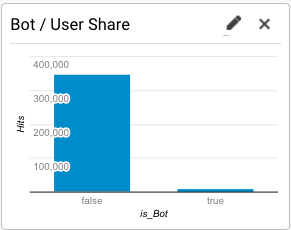
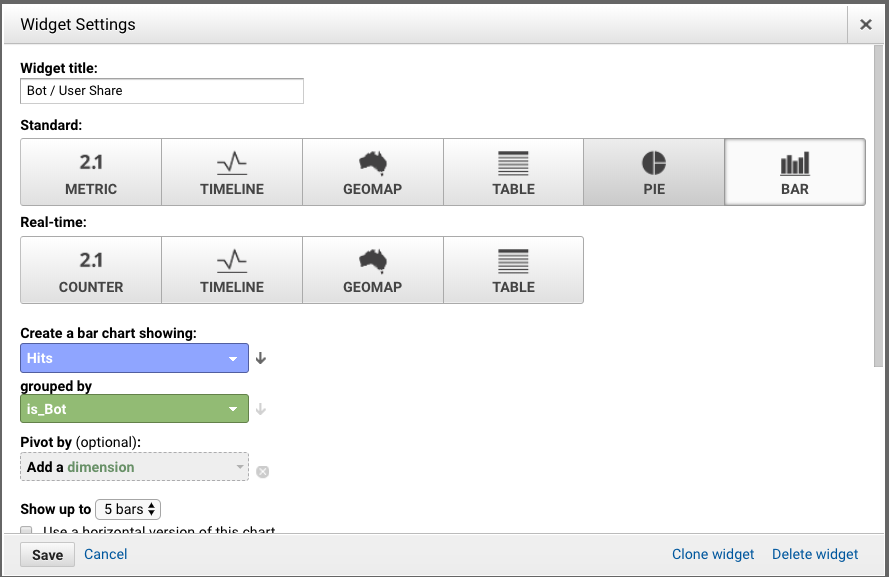
By the way, it’s also possible to customise any of the widgets in the custom dashboard. Let’s customize the Is Bot false vs true widget. Firstly, click on the little pen icon in the top right corner of the widget.
Select the view you want; we’ll select a pie chart. Finally, click Save.
Now, you can see this data displayed as a pie chart including the percentage.
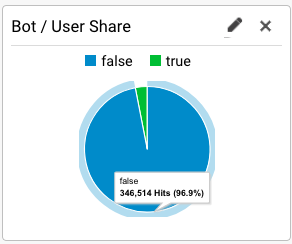
For this site, we can see that 96.9% of the traffic to this site is human. Based on studies such as a wide-reaching report by Incapsala, the average number of bot traffic to a website was 52%. This figure can range greatly depending on the site.
How Accurate is Google Analytics?
Ok, time to answer the original question more thoroughly. So if we have our total number of human visitors, how many of these did Google Analytics fail to detect?
Firstly, we are going to export two data sets: 1) the Log Hero traffic data and 2) the Google Analytics traffic data.
Exporting Log Hero Traffic Data
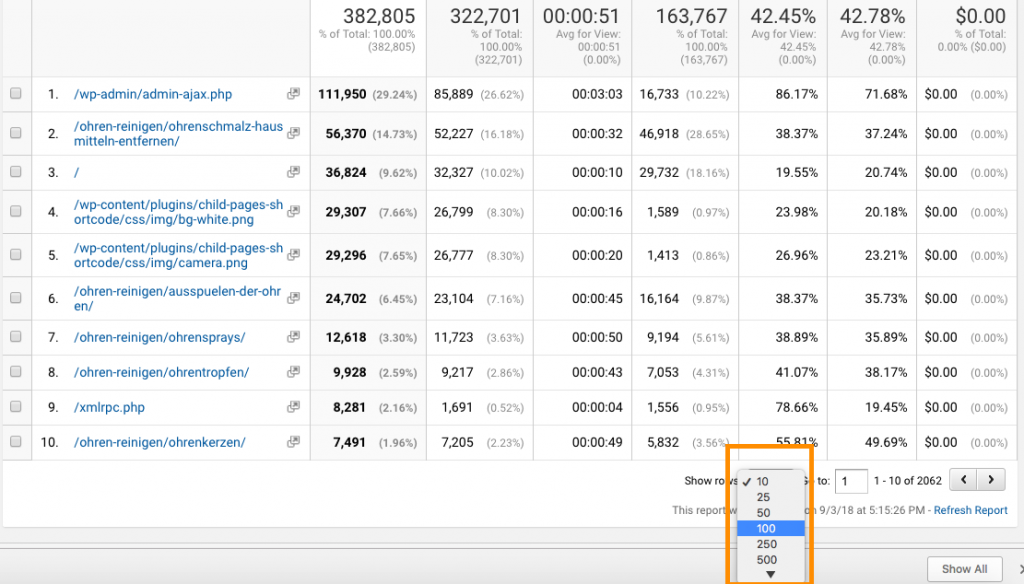
- From the main view of your Log Hero property (Behaviour > Site Content > All Pages) set the correct date range you want to analyze.
- Make sure Is Bot is set as a secondary dimension and you use the advanced filter (Is Bot = FALSE) to only show the non-bot traffic.
- Select the number of rows of data you would like to export, for this example we will select 100.
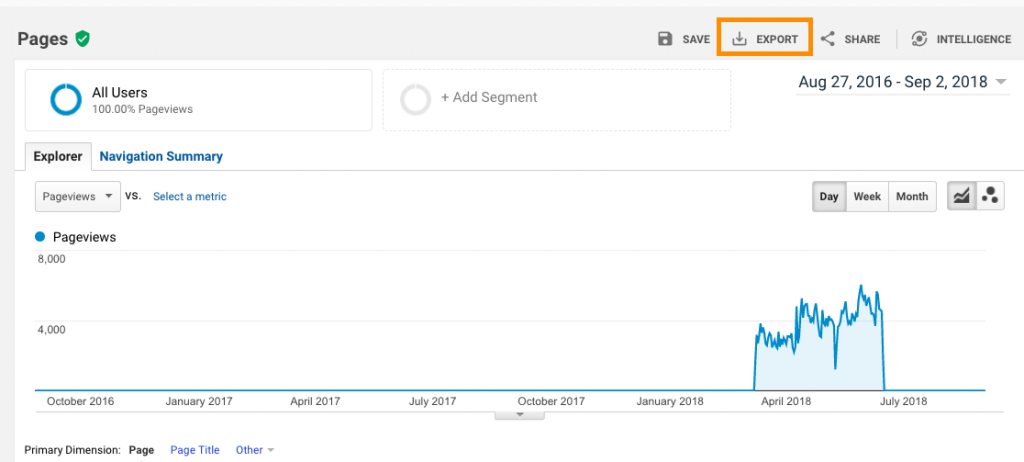
You can use either use GA’s export function or if you have more than 5,000 landing pages, our GA Downloader.
Export this data to a Google Sheet or Excel (all steps are the same regardless of your preferred software)
Open the file after it has downloaded in Excel or click Import document if you are working with Google Sheets.

Exporting Google Analytics Traffic Data
Now, we need to import the second set of data from your standard Google Analytics property. For maximum data accuracy, use the same view Behaviour > Site Content > All Pages and set the same data range as you did in Log Hero. Export this data to a Google Sheet or Excel worksheet precisely as above. The only data we are interested in is the Page and Page Views metrics so you can delete the rest.
Now copy one of the data sets to another tab of the first data set, so that you have both sets of data in one worksheet. Let’s call the first tab GA Log Data and the second GA_Data. To follow this example, add the following columns to the first tab:
- Pageviews Google Analytics – this is where we will insert the data from the other tab.
- Missing – this is the difference between the two datasets.
- Percentage Missing – this is the percentage difference between the two datasets.
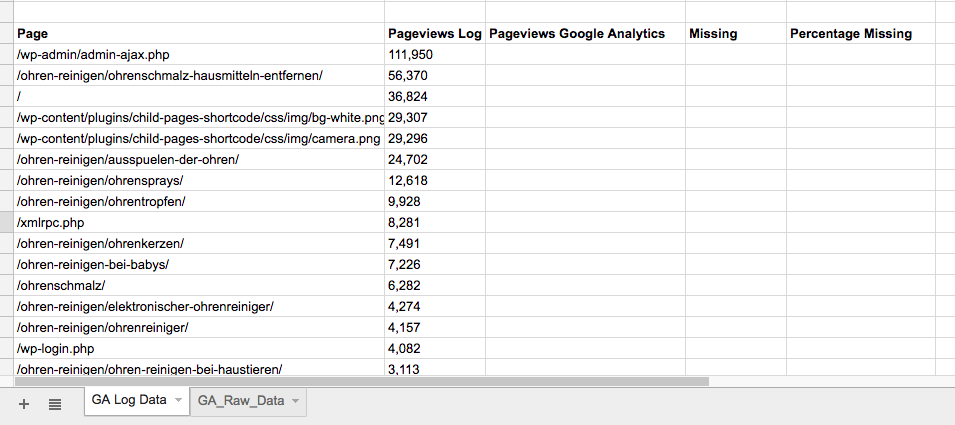
On the second tab, we have only the page and page views data from your standard Google Analytics property:
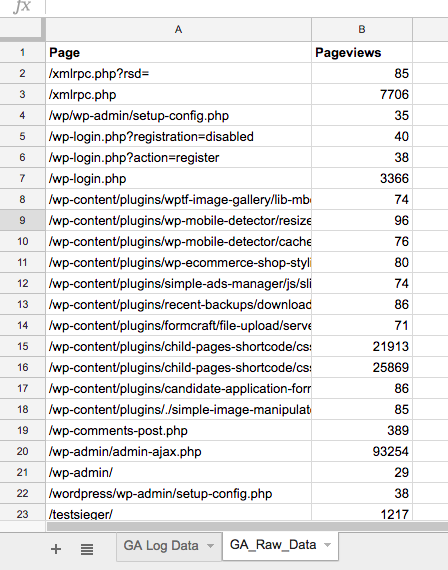
As your data is randomly ordered, you cannot copy and paste it from one tab to the other, because the landing pages would not match up. This means we have to use what is called a VLOOKUP function.
What is the VLOOKUP Function?
Advanced users can skip ahead. V stands for vertical. The VLOOKUP function in Excel or Google Sheets searches columns and returns more information from that row. It is incredibly useful for searching large amounts of data quickly and returning values.
The syntax for the VLOOKUP function is the same in both Google Sheets and Excel:
=VLOOKUP(search term, search range, column to return data from, match type)
- Search term: this is the term you are looking for and can be a number (42), a string “hologram”, or a cell B52.
- Search range: this is the range of cells you are going to search to find our search term. Usually this a column or multiple columns of data.
- Column to return data from: If you search column A for the search term “Hologram” you can return the data from Column B associated with this, in this example the definition. This is a number counting from the first column of the range. So column A in a range = 1; B = 2 etc.
- Match type: Setting this to TRUE performs a broad match; setting this to FALSE performs an exact match. For our purposes, you will want to set this to FALSE. By default, this is set to TRUE so don’t forget to change this.
Ok so let’s recap. You want to look up the name of the Landing page from our first tab to find the corresponding landing page on the next tab (GA_Raw_Data) and return the corresponding number of page views.
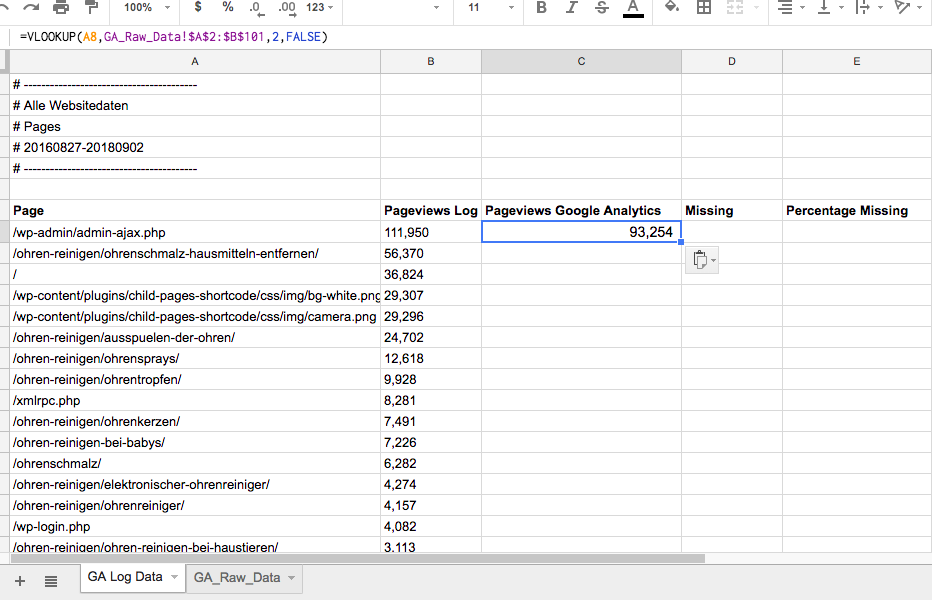
So in the first row of column “Pageviews Google Analytics” on our GA Log Data tab we enter:
=VLOOKUP(A8,GA_Raw_Data!$A$2:$B$101,2,FALSE)
Let’s break this formula down,
- This formula searches for the value in “A8,” i.e. the name of the landing page.
- On the other tab GA_Raw_Data, it searches across the specified range using dollar signs to lock in the range ($A$2:$B$101).
- It returns the value from the second collum of data by specifying the argument “2”.
- Setting the final value to FALSE means that it looks for an exact match.
This shows us that the Google Analytics figure is much less than the figure from the log files.
Next, copy and paste this formula for your entire range of data. Calculate the difference between the two columns. Finally, calculate the percentage of page views missing using the following formula:
(Missing / Pageviews in Log Hero) * 100
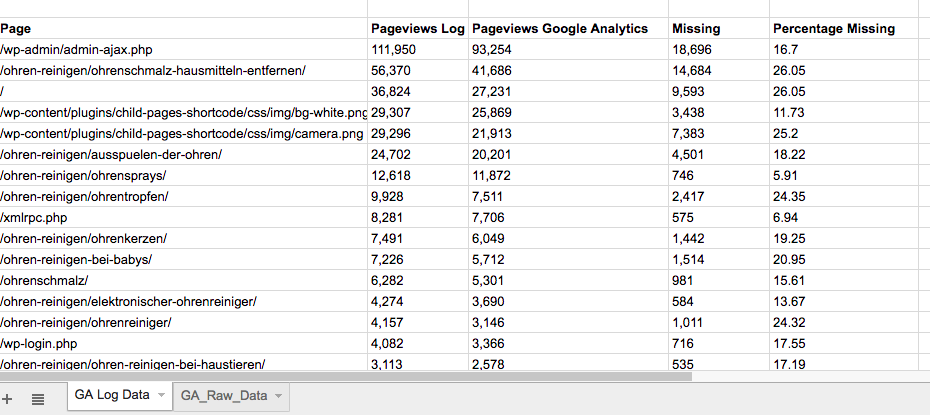
This should result in a worksheet that looks something like this:
Unlock your log file data today for more accurate data-driven decisions
We can see that for many landing pages the Google Analytics figure is much less, up to 26%. For our date range, the total number of page views missed by GA was around 72,000 or 19%. This figure is significant when making marketing decisions, calculating server load, or optimizing pages for SEO.
To recap:
- We automatically calculated bot vs human traffic
- We found that GA traffic data is inaccurate by up to 25%
Unlock your log file data today with Log Hero.