If you haven’t installed Log Hero yet, you can read this step by step tutorial. After you’ve installed the Hero, you will get your log data pushed to Google Analytics in real-time.
Spotting bots in Google Analytics
You find all hits, whether they came from users or from bots, in your new Google Analytics property. The Hero automatically creates the new property in the first step of your set up process. It is called “Log Hero – {YOUR NAME}”.
The Log Hero standard view
The view we recommend most to analyze your bot traffic is what we call the Log Hero standard view. You’ll have many references to it in our many of our articles.
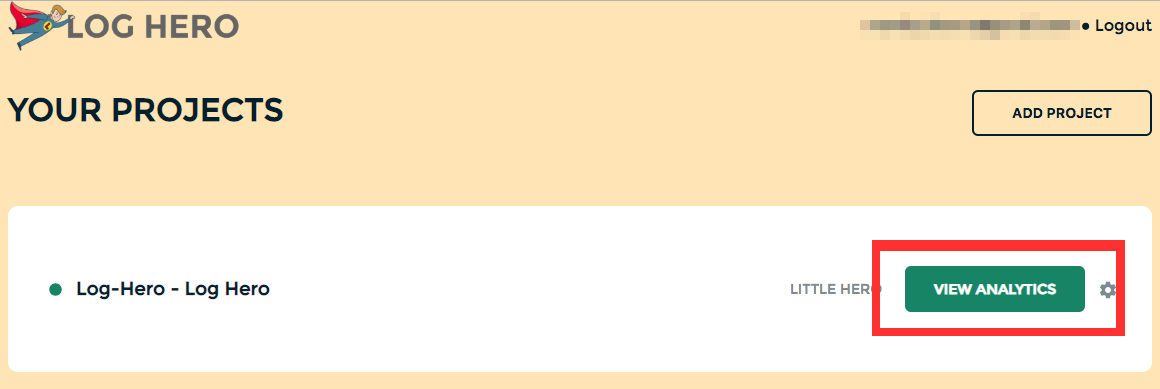
To get there, you can log into your profile and click on “View Analytics”.
Alternatively, you can go to Google Analytics and select the Log Hero property (click on the GA logo on the top left and look for Log Hero – {{Your Name}}.
To get there, you select in the left menu 1. Behavior, 2. Site Content and finally 3. All Pages.
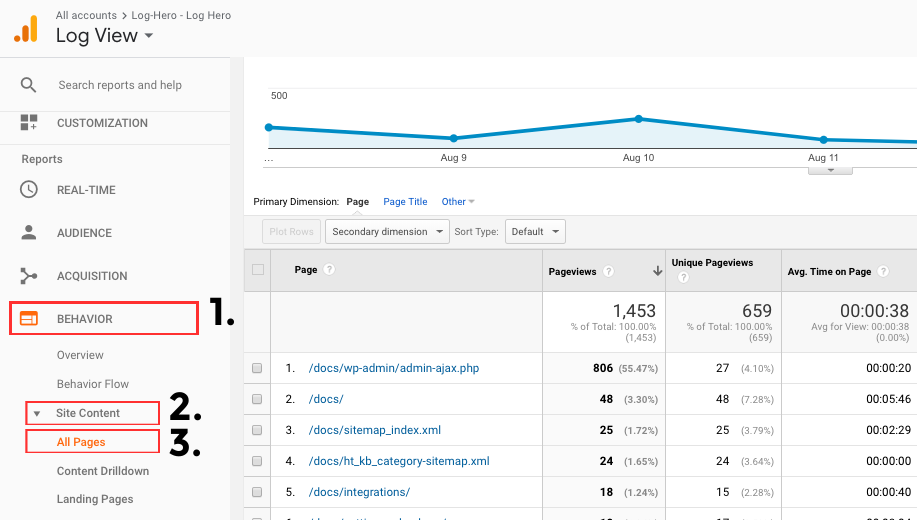
Now you see all pages / resources that were requested by bots or humans and can start with your analysis.
Analyzing the data
Great, you’ve come that far! Now it’s about making something out of what you see. But what do you really see? (If you want to jump right into the use cases, go here.)
Log Hero uploads all requests from both humans and bots to Google Analytics as page views. This way you can rebuild sessions in GA and follow the bots as if they were human visitors.
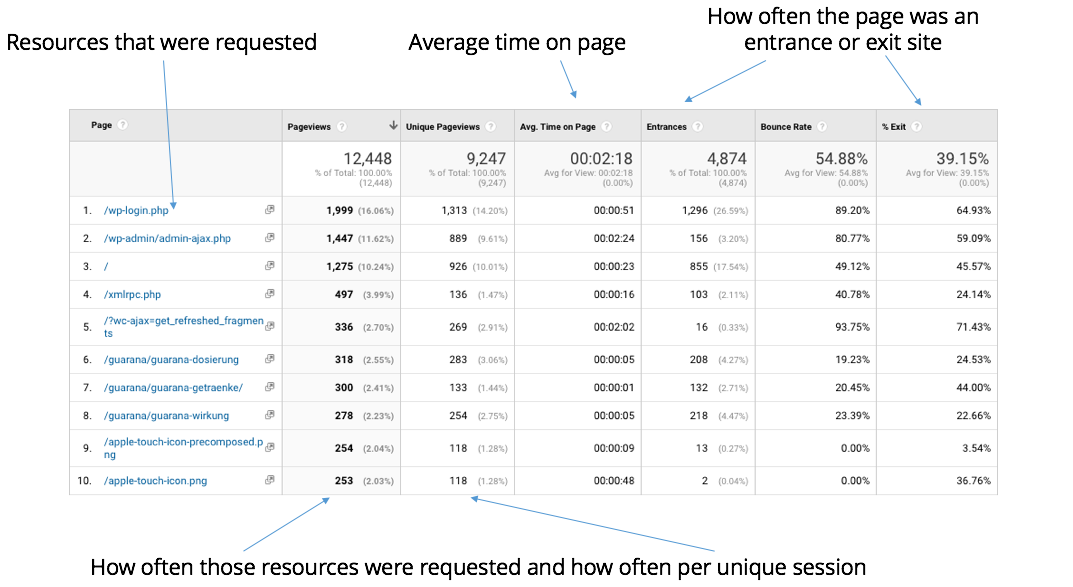
This is a typical Log Hero account. Instead of only landing pages on the very left, you actually see all resources that were crawled. This means you’ll see image files, robots.txt and your normal standard landing pages all in Google Analytics.
Using Hero’s custom dimensions
The Hero adds new and custom dimensions to the Log view that are essential for analyzing the data properly.
The free version of Log Hero gives you the following two custom dimensions, which are useful for a lot of use cases:
User Agent: see who triggered a hit – whether it was a bot or a human – by adding the custom dimension user agent. Read more about how to use it here.
HTTP Status Codes: see how your site responds upon being called, either by bots or humans. The most well-known is the infamous 404 if a URL was called but couldn’t be found. Super important to monitor your domains performance for different user agents.
You can activate the dimensions by clicking on the button “secondary dimension” in your Log Hero view:
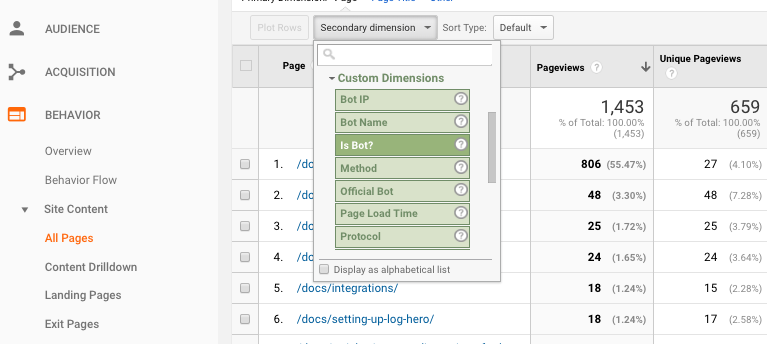
In the example above, we added is bot? to be able to quickly filter out all human traffic and focus on bots only. o read more about secondary dimensions, go here.
Using Hero’s dashboards
To make it easier for you to analyze how bots crawl and index your site, the Hero created several custom dashboards and reports for your Google Analytics account. You can go here and add the dashboards to your Log Hero property by clicking on the “GET IT!” link above each dashboard.
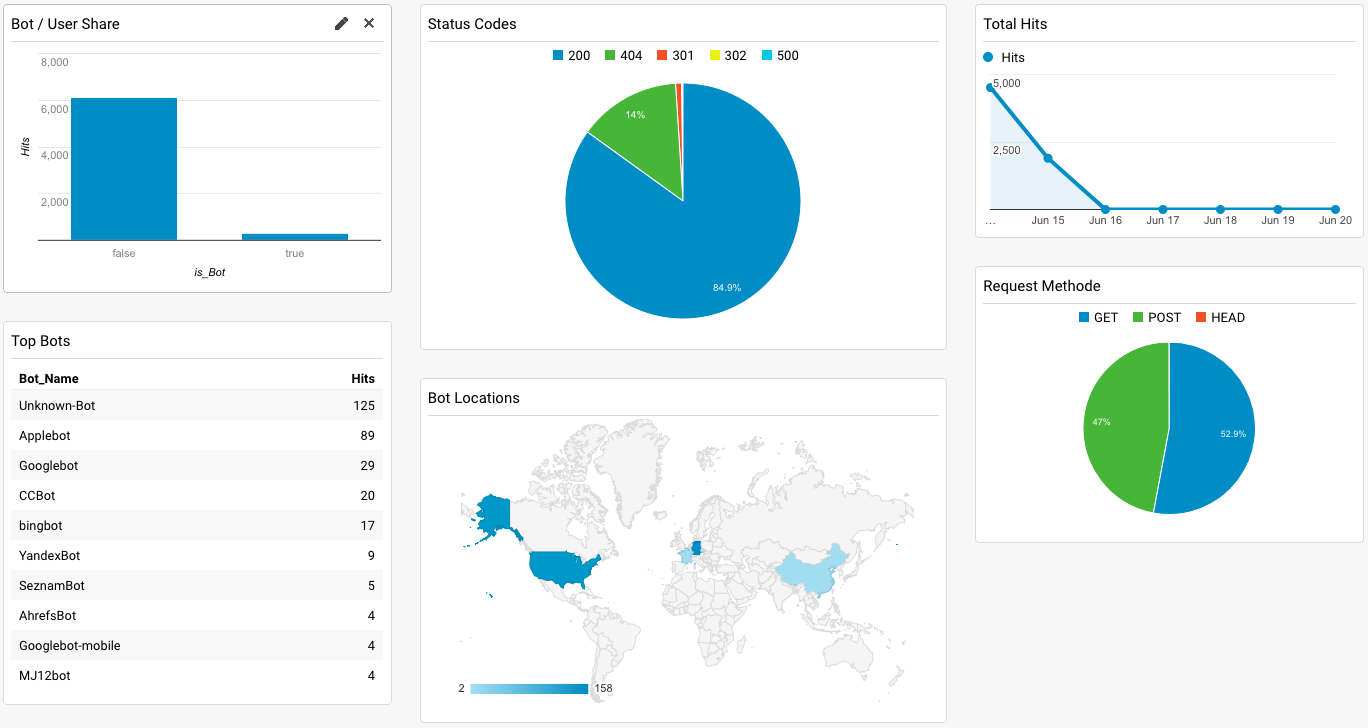
Log Hero’s Log Premium dashboard gives you your most important log data at a single glance.